As your organization builds the foundation of your strategic plan, it’s likely to come to your attention you’ll need to gain consensus around what your key performance indicators (KPIs) will be and how they will impact your plan. If you don’t know the basics of KPIs or need guidance on KPI development, we are here to help!
We’ve compiled a complete guide that includes an overview of what makes a good KPI, the benefits of good key performance indicators (KPIs), and a list of KPI examples organized by department and industry to reference build your organization’s strategic plan and goals.

What is a Key Performance Indicator KPI — KPI Definition
Key performance indicators, or KPIs, are the elements of your organization’s plan that express the quantitative outcomes you seek and how you will measure success. In other words, they tell you what you want to achieve and by when.
They are the qualitative, quantifiable, outcome-based statements you’ll use to measure progress and determine if you’re on track to meet your goals or objectives. Good plans use 5-7 KPIs to manage and track their progress against goals. A good key performance indicator measures strategic goals.
What is KPI Meaning, and Why Do You Need Them?
Key performance indicators are intended to create a holistic picture of how your organization is performing against its intended targets, organizational goals, business goals, or objectives. A great key performance indicator should accomplish all the following:
- Outline and measure your organization’s most important set of outputs.
- Work as the heartbeat of your performance management process and confirm whether progress is being made against your strategy.
- Represent the key elements of your strategic plan that express what you want to achieve by when.
- Measure the quantifiable components of your strategic goals and objectives.
- Measure the most important leading indicators and lagging measures in your organization.
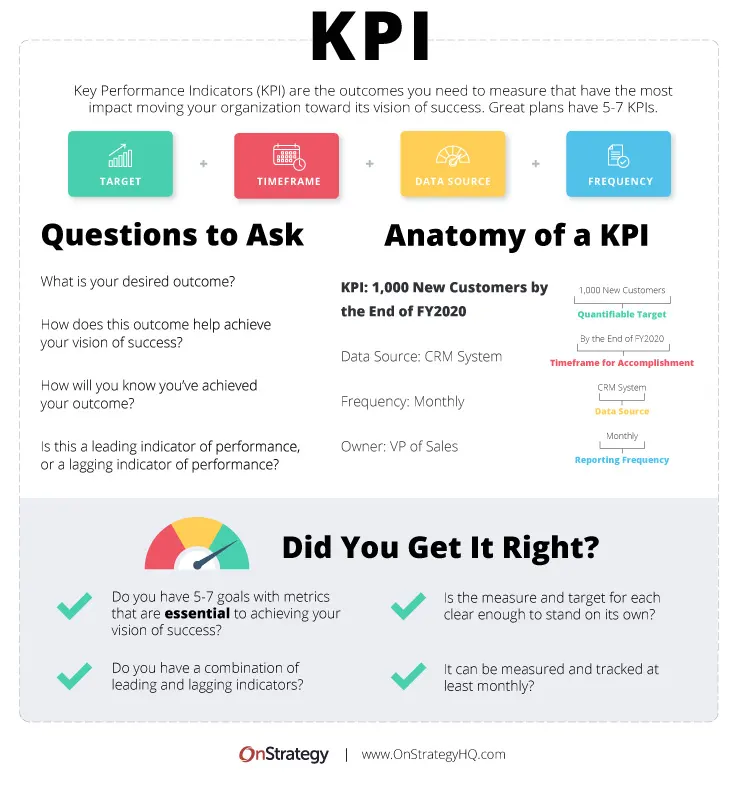
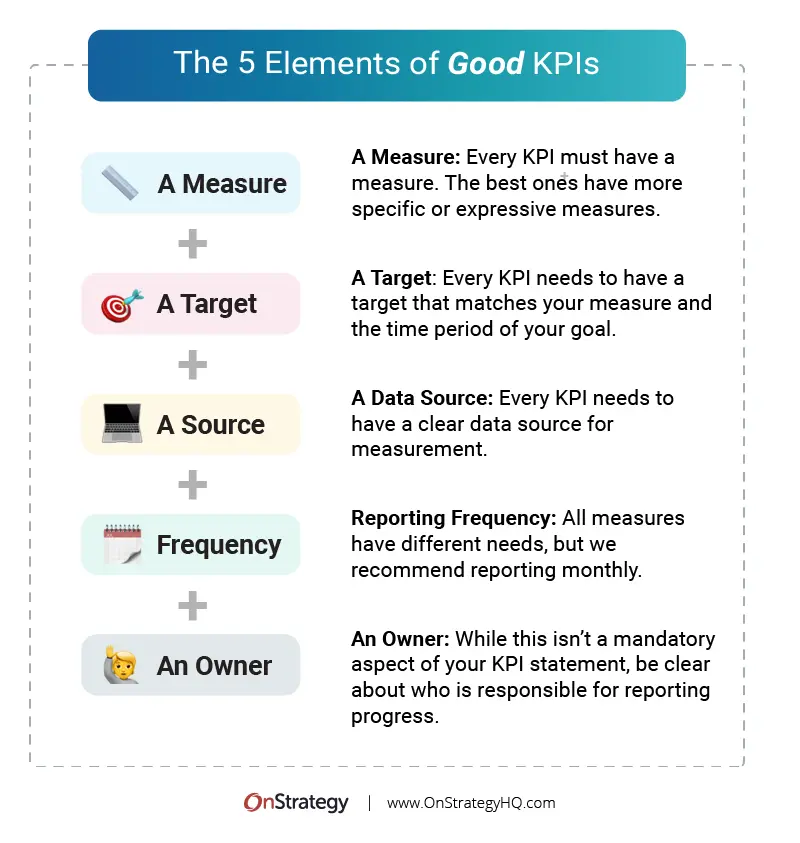
The Five Elements of a KPI
These are the heartbeat of your performance management process and must work well! Your plan’s strategic KPIs tell you whether you’re making progress or how far you are from reaching your goals. Ultimately, you want to make progress against your strategy. You’ll live with these KPIs for at least the quarter (preferably the year), so make sure they’re valuable!
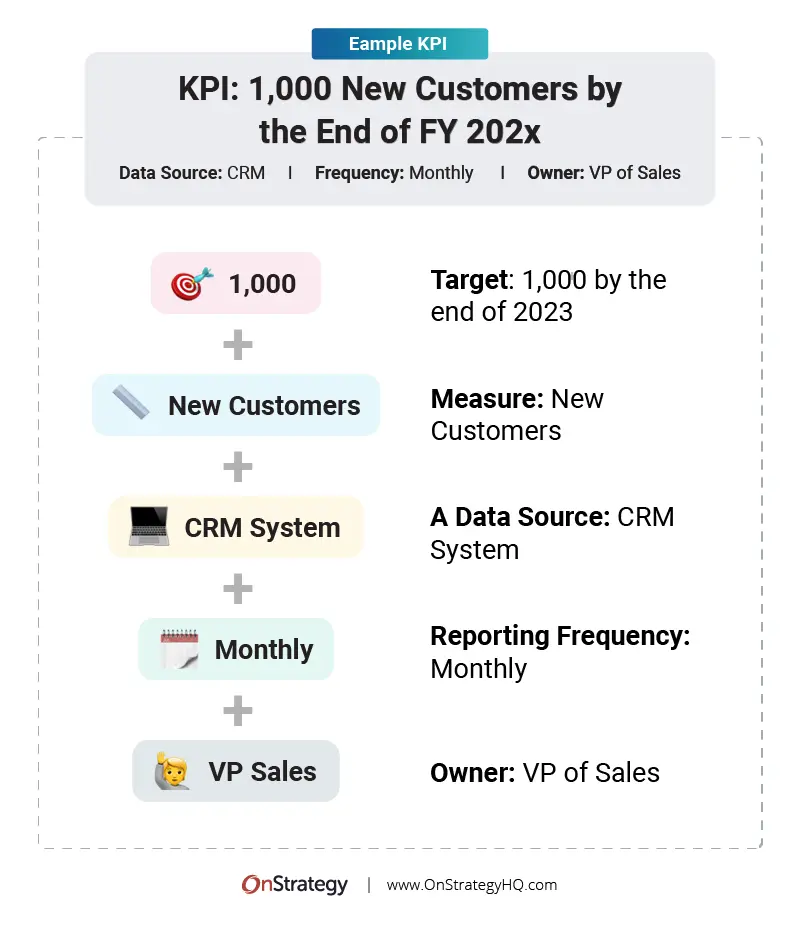
Great strategies track the progress of core elements of the plan. Each key performance indicator needs to include the following elements:
- A Measure:Every KPI must have a measure. The best ones have more specific or expressive measures.
- A Target: Every KPI needs to have a target that matches your measure and the period of your goal. These are generally a numeric values you’re seeking to achieve.
- A Data Source: Each of these needs to have a clearly defined data source so there is no gray area in measuring and tracking each.
- Reporting Frequency: Different measures may have different reporting needs, but a good rule to follow is to report on them at least monthly.
- Owner: While this isn’t a mandatory aspect of your KPI statement, setting expectations of who will take care of tracking, reporting, and refining specific KPIs is helpful to your overall organizational plan.
Indicators vs. Key Performance Indicators
Indicators
An indicator is a general term that describes a business’s performance metrics.
There can be several types of indicators a company may track, but not all indicators are KPIs, especially if they don’t tie into an organization’s overall strategic plan or objectives, which is a MUST!
Key Performance Indicators
On the other hand, a key performance indicator is a very specific indicator that measures an organization’s progress toward a specific company-wide goal or objective. We typically recommend you narrow down the KPIs your organization tracks to no more than 7. When you track too many goals, it can get daunting and confusing.
Pro Tip:
You should only track the best and most valuable indicators that tie to your organization’s long-term strategic goals and direction.
Benefits of Good Key Performance Indicators
What benefits do key performance indicators have on your strategic plan, and on your organization as a whole? A lot of benefits, actually! They are extremely important to the success of your strategic plan as they help you track progress of your goals. Implementing them correctly is critical to success.
- Benefit #1: They provide clarity and focus to your strategic plan by measuring progress and aligning your team’s efforts to the organization’s objectives. They also show your measurable progress over time and create ways to track your organization’s continued improvement.
- Benefit #2: Key performance indicators create a way to communicate a shared understanding of success. They give your team a shared understanding of what’s important to achieve your long-term vision and create a shared language to express your progress.
- Benefit #3: They provide signposts and triggers to help you identify when to act. A good balance of leading and lagging key performance indicators allow you to see the early warning signs when things are going well, or when it’s time to act.
How to Develop KPIs
We’ve covered this extensively in our How to Identify Key Performance Indicators post. But, here’s a really quick recap:
Step 1: Identify Measures that Contribute Directly to Your Annual Organization-wide Objectives
Ensure you select measures that can be directly used to quantify your most important annual objectives.
PRO TIP:
It doesn’t matter what plan structure you’re using – balanced scorecard, OKRs, or any other framework – the right KPIs for every objective will help you measure if you’re moving in the right direction.
Step 2: Evaluate the Quality of Your KPI
Select a balance of leading and lagging indicators (which we define later in the article) that are quantifiable and move your organization forward. Always ensure you have relevant KPIs. Having the right key performance indicators makes a world of difference!
Step 3: Assign Ownership
Every key performance indicator needs ownership! It’s just that simple.
Step 4: Monitor and Report with Consistency
Whatever you do, don’t just set and forget your goals. We see it occasionally that people will select measures and not track them, but what’s the point of that? Be consistent. We recommend selecting measures that can be reported upon at least monthly.
The 3 Types of KPIs to Reference as You Build Your Metrics
Key performance indicators answer the quantifiable piece of your goals and objectives. here are three types of KPIs. Now that you know the components of great key performance indicators, here are some different ones that you might think about as you’re putting your plan together:
Broad Number Measures
The first type of KPI is what we like to call broad number measures. These are the ones that essentially count something. An example is counting the number of products sold or the number of visits to a webpage.
PRO TIP:
There is nothing wrong with these, but they don’t tell a story. Great measures help you create a clear picture of what is going on in your organization. So, using only broad ones won’t help create a narrative.
KPI Type #2: Progress Measures
Progress key performance indicators are used to help measure the progress of outcomes. This is most commonly known as the “percent complete” KPI, which is helpful in measuring the progress of completing a goal or project. These are best when quantifiable outcomes are difficult to track, or you can’t get specific data.
PRO TIP:
Progress KPIs are great, but your KPI stack needs to include some easily quantifiable measures. We recommend using a mixture of progress KPIs and other types that have clear targets and data sources.
KPI Type #3: Change Measures
The final type of KPI is a change indicator. These are used to measure the quantifiable change in a metric or measure. An example would be, “X% increase in sales.” It adds a change measure to a quantifiable target and is usually measured as a percentage increase in a given period of time.
The more specific change measures are, the easier they are to understand. A better iteration of the example above would be “22% increase in sales over last year, which represents an xyz lift in net-new business.” More expressive measures are better.
PRO TIP:
Change measures are good for helping create a clear narrative. It helps explain where you’re going instead of just a simple target.
Leading KPIs vs Lagging KPIs
Part of creating a holistic picture of your organization’s progress is looking at different types of measures, like a combination of leading and lagging indicators. Using a mixture of both allows you to monitor progress and early warning signs closely when your plan is under or over-performing (leading indicator) and you have a good hold on how that performance will impact your business down the road (lagging indicator). Here’s a deep dive and best practices on using leading versus lagging indicators:
Leading Indicator
We often refer to these metrics as the measures that tell you how your business might/will perform in the future. They are the warning buoys you put out in the water to let you know when something is going well and when something isn’t.
For example, a leading KPI for an organization might be the cost to deliver a good/service. If the cost of labor increases, it will give you a leading indicator that you will see an impact on net profit or inventory cost.
Another example of a leading indicator might be how well your website is ranking or how well your advertising is performing. If your website is performing well, it might be a leading indicator that your sales team will have an increase in qualified leads and contracts signed.
Lagging Indicator
A lagging indicator refers to past developments and effects.This reflects the past outcomes of your measure. So, it lags behind the performance of your leading indicators.
An example of a lagging indicator is EBITA. It reflects your earnings for a past date. That lagging indicator may have been influenced by leading indicators like the cost of labor/materials.
Balancing Leading and Lagging Indicators
If you want to ensure that you’re on track, you might have a KPI in place telling you whether you will hit that increase, such as your lead pipeline. We don’t want to over-rotate on this, but as part of a holistic, agile plan, we recommend outlining 5-7 key performance metrics or indicators in your plan that show a mix of leading and lagging indicators..
Having a mixture of both gives you both a look-back and a look-forward as you measure the success of your plan and business health. A balanced set of KPIs also gives you the data and business intelligence you need for making decision making and strategic focus.
We also recommend identifying and committing to tracking and managing the same KPIs for about a year, with regular monthly or quarterly reporting cadence, to create consistency in data and reporting.
Any shorter tracking time frame won’t give you a complete picture of your performance. Always moving your KPI targets is also a sure way to miss how you’re actually performing.
27 KPI Examples
Sales Key Performance Indicators
Sales KPIs are essential metrics for evaluating a company’s revenue generation process and leading indicators for achieving financial goals. Using sales performance KPIs can provide leading insights beyond traditional financial metrics, which are often considered lagging indicators
- Number of contracts signed per quarter
- Dollar value for new contracts signed per period
- Number of qualified leads per month
- Number of engaged qualified leads in the sales funnel
- Hours of resources spent on sales follow up
- Average time for conversion
- Net sales – dollar or percentage growth
- New sales revenue
- Growth rate
- Customer acquisition count
- Lead conversion rate
- Average sales cycle
Increase the number of contracts signed by 10% each quarter.
- Measure: Number of contracts signed per quarter
- Target: Increase number of new contracts signed by 10% each quarter
- Data Source: CRM system
- Reporting Frequency: Weekly
- *Owner: Sales Team
- Due Date: Q1, Q2, Q3, Q4
Increase the value of new contracts by $300,000 per quarter this year.
- Measure: Dollar value for new contracts signed per period
- Target: Sign $300,000 worth of net new contracts per quarterlip>
- Data Source: Hubspot Sales Funnel
- Reporting Frequency: Monthly
- *Owner: VP of Sales
- Due Date: Q1, Q2, Q3, Q4
Increase the close rate to 30% from 20% by the end of the year.
- Measure: Close rate – number of closed contracts/sales qualified leads
- Target: Increase close rate from 20% to 30%
- Data Source: CRM system
- Reporting Frequency: Monthly
- *Owner: Director of Sales
- Due Date: December 31, 2024
Increase the number of weekly engaged qualified leads in the sales from 50 to 75 by the end of FY23.
- Measure: Number of engaged qualified leads in sales funnel
- Target: 50 to 75 by end of FY2024
- Data Source: Marketing and Sales CRM
- Reporting Frequency: Monthly
- *Owner: Head of Sales
- Due Date: December 31, 2024
Decrease time to conversion from 60 to 45 days by Q3 2024.
- Measure: Average time for conversion
- Target: 60 days to 45 days
- Data Source: CRM system
- Reporting Frequency: Monthly
- *Owner: Director of Sales
- Due Date: Q3 2024
Increase number of closed contracts by 2 contracts/week in 2024.
- Measure: Number of closed contracts
- Target: Increase closed contracts a week from 4 to 6
- Data Source: Sales Pipeline
- Reporting Frequency: Monthly
- *Owner: Sales and Marketing Team
- Due Date: December 31, 2024
Examples of KPIs for Financial
- Growth in revenue
- Net profit margin
- Gross profit margin
- Operational cash flow
- Current accounts receivables
- Operating expenses
- Average cost of goods or services
- Average account lifetime total value
Financial KPIs as SMART Annual Goals
Grow top-line revenue by 10% by the end of 2024.
- Measure: Revenue growth
- Target: 10% growt
- Data Source: Quickbooks
- Reporting Frequency: Monthly
- *Owner: Finance and Operations Team
- Due Date: By the end 2024
Increase gross profit margin by 12% by the end of 2024.
- Measure: Percentage growth of net profit margin
- Target: 12% net profit margin increase
- Data Source: Financial statements
- Reporting Frequency: Monthly
- *Owner: Accounting Department
- Due Date: By the end 2024
Increase net profit margin from 32% to 40% by the end of 2024.
- Measure: Gross profit margin in percentage
- Target: Increase gross profit margin from 32% to 40% by the end of 2024
- Data Source: CRM and Quickbooks
- Reporting Frequency: Monthly
- *Owner: CFO
- Due Date: By the end 2024
Maintain $5M operating cash flow for FY2024.
- Measure: Dollar amount of operational cash flow
- Target: $5M average
- Data Source: P&L
- Reporting Frequency: Monthly
- *Owner: CFO
- Due Date: By the end FY2024
Collect 95% of account receivables within 60 days in 2024.
- Measure: Accounts collected within 60 days
- Target: 95% in 2024
- Data Source: Finance
- Reporting Frequency: Monthly
- *Owner: Accounting Department
- Due Date: End of 2024
Examples of Customer Service KPIs
- Number of customers retained/customer retention
- Customer service response time
- Percentage of market share
- Net promotor score
- Customer satisfaction score
- Average response time
Customer KPIs in a SMART Framework for Annual Goals
90% of current customer monthly subscriptions during FY2024.
- Measure: Number of customers retained
- Target: Retain 90% percent of monthly subscription customers in FY2024
- Data Source: CRM software
- Reporting Frequency: Monthly
- *Owner: Director of Client Operations
- Due Date: End of 2024
Increase market share by 5% by the end of 2024.
- Measure: Percentage of market share
- Target: Increase market share from 25%-30% by the end of 2024
- Data Source: Market research reports
- Reporting Frequency: Quarterly
- *Owner: Head of Marketing
- Due Date: End of 2024
Increase NPS score by 9 points in 2024.
- Measure: Net Promoter Score
- Target: Achieve a 9-point NPS increase over FY2024
- Data Source: Customer surveys
- Reporting Frequency: Monthly
- *Owner: COO
- Due Date: End of 2024
Achieve a weekly ticket close rate of 85% by the end of FY2024.
- Measure: Average ticket/support resolution time
- Target: Achieve a weekly ticket close rate of 85%
- Data Source: Customer support data
- Reporting Frequency: Weekly
- *Owner: Customer Support Team
- Due Date: End of 2024
Examples of KPIs for Operations
- Order fulfillment time
- Time to market
- Employee satisfaction rating
- Employee churn rate
- Inventory turnover
- Total number of units produced or on-hand
- Resource utilization
Operational KPIs as SMART Annual Goals
Average 3 days maximum order fill time by the end of Q3 2024.
- Measure: Order fulfilment time
- Target: Average maximum of 3 days
- Data Source: Order management software
- Reporting Frequency: Monthly
- *Owner: Shipping Manager
- Due Date: Q3 2024
Achieve an average SaaS project time-to-market of 4 weeks per feature in 2024.
- Measure: Average time to market
- Target: 4 weeks per feature
- Data Source: Product development and launch data
- Reporting Frequency: Monthly
- *Owner: Product Development Team
- Due Date: End of 2024
Earn a minimum score of 80% employee satisfaction survey over the next year.
- Measure: Employee satisfaction rating
- Target: Earn a minimum score of 80% employee
- Data Source: Employee satisfaction survey and feedback
- Reporting Frequency: Monthly
- *Owner: Human Resources
- Due Date: December 31, 2024
Maintain a maximum of 10% employee churn rate over the next year.
- Measure: Employee churn rate
- Target: Maintain a maximum of 10% employee churn rate over the next year
- Data Source: Human resources and payroll data
- Reporting Frequency: Monthly
- *Owner: Human Resources
- Due Date: December 31, 2024
Achieve a minimum ratio of 5-6 inventory turnover in 2024.
- Measure: Inventory turnover ratio
- Target: Minimum ratio of 5-6
- Data Source: Inventory management software
- Reporting Frequency: Monthly
- *Owner: Operations Department
- Due Date: End of 2024
Marketing KPIs
- Monthly website traffic
- Conversion rate for call-to-action content
- Keywords in top 10 search engine results/organic search
- Blog articles published this month
- E-Books published this month
- Marketing campaign performance
- Customer acquisition cost
- Landing page conversion rate
Marketing KPIs as SMART Annual Goals
Achieve a minimum of 10% increase in monthly website traffic over the next year.
- Measure: Monthly website traffic
- Target: 10% increase in monthly website
- Data Source: Google analytics
- Reporting Frequency: Monthly
- *Owner: Marketing Manager
- Due Date: End of 2024
Generate a minimum of 200 qualified leads per month in 2024.
- Measure: Number of marketing qualified leads
- Target: 200 qualified leads per month
- Data Source: Hubspot
- Reporting Frequency: Monthly
- *Owner: Marketing Manager
- Due Date: December 31, 2024
Achieve a minimum of 10% conversion rate for on-page CTAs by end of Q3 2024.
- Measure: Conversion rate on service pages
- Target: 10%
- Data Source: Hubspot
- Reporting Frequency: Weekly
- *Owner: Marketing Manager
- Due Date: End of Q3, 2024
Achieve a minimum of 20 high-intent keywords in the top 10 search engine results over the next year.
- Measure: Keywords in top 10 search engine results
- Target: 20 keywords
- Data Source: SEM Rush data
- Reporting Frequency: Weekly
- *Owner: SEO Manager
- Due Date: December 31, 2024
Publish a minimum of 4 blog articles per month to earn new leads in 2024.
- Measure: Blog articles
- Target: 4 per month
- Data Source: CMS
- Reporting Frequency: Monthly
- *Owner: Content Marketing Manager
- Due Date: December 2024
Publish at least 2 e-books per quarter in 2024 to create new marketing-qualified leads.
- Measure: E-Books published
- Target: 2 per quarter
- Data Source: Content management system
- Reporting Frequency: Quarterly
- *Owner: Head of Marketing
- Due Date: December 2024
Bonus: +40 Extra KPI Examples
Supply Chain Example Key Performance Indicators
- Number of on-time deliveries
- Inventory carry rate
- Months of supply on hand
- Inventory-to-sales Ratio (ISR)
- Carrying cost of inventory
- Inventory turnover rate
- Perfect order rate
- Inventory accuracy
- Fill rate
Healthcare Example Key Performance Indicators
- Bed or room turnover
- Average patient wait time
- Average treatment charge
- Average insurance claim cost
- Medical error rate
- Patient-to-staff ratio
- Medication errors
- Average emergency room wait times
- Average insurance processing time
- Billing code error rates
- Average hospital stay
- Patient satisfaction rate
Human Resource Example Key Performance Indicators
- Organization headcount
- Average number of job vacancies
- Applications received per job vacancy
- Job offer acceptance rate
- Cost per new hire
- Average salary
- Average employee satisfaction
- Employee turnover rate
- New hire training Effectiveness
- Employee engagement score
Social Media Example Key Performance Indicators
- Average engagement
- % Growth in following
- Traffic conversions
- Social interactions
- Website traffic from social media
- Number of post shares
- Social visitor conversion rates
- Mentions
- Issues resolved using social channel
- Social media engagement
Conclusion: Keeping a Pulse on Your Plan
With the foundational knowledge of the KPI anatomy and a few example starting points, it’s important you build out these metrics with detailed and specific data sources so you can truly evaluate if you’re achieving your goals. Remember, these will be the 5-7 core metrics you’ll live by for the next 12 months, so it’s crucial to develop effective KPIs that follow the SMART formula.They should support your business strategy, measure the performance of your strategic objectives, and help you make better decisions.
A combination of leading and lagging KPIs will paint a clear picture of your organization’s strategic performance and empower you to make agile decisions to impact your team’s success.
Need a Dedicated App to Track Your Strategic Plan with KPI Dashboards? We’ve got you covered.
The StrategyHub by OnStrategy is a purpose built tool to help you build and manage a strategic plan with KPIs. Run your strategy reviews with zero prep – get access to our full suite of KPI reports, dynamic dashboards for data visualization, access to your historical data, and reporting tools to stay connected to the performance of your plan. Get 14-day free access today!
Our Other KPI Resources
We have several other great resources to consider as you build your organization’s Key Performance Indicators! Check out these other helpful posts and guides:
- OKRs vs. KPIs: A Downloadable Guide to Explain the Difference
- How to Identify KPIs in 4 Steps
- KPIs vs Metrics: Tips and Tricks to Performance Measures
- Guide to Establishing Weekly Health Metrics
- A Measure – The best KPIs have more expressive measures.
- A Target – Every KPI needs to have a target that matches your measure and the time period of your goal.
- A Data Source – Every KPI needs to have a clearly defined data source.
- Reporting Frequency – A defined reporting frequency.
FAQs on Key Performance Indicators
KPI stands for Key Performance Indicators. KPIs are the elements of your organization’s business or strategic plan that express what outcomes you are seeking and how you will measure their success. They express what you need to achieve by when. KPIs are always quantifiable, outcome-based statements to measure if you’re on track to meet your goals and objectives.
The 4 elements of key performance indicators are:
No, KPIs (Key Performance Indicators) are different from metrics. Metrics are quantitative measurements used to track and analyze various aspects of business performance, while KPIs are specific metrics chosen as indicators of success in achieving strategic goals.


HI Erica
hope your are doing well,
Sometime Strategy doesn’t cover all the activities through the company, like maintenance for example may be quality control …. sure they have a contribution in the overall goals achievement but there is no specific new requirement for them unless doing their job, do u think its better to develop a specific KPIs for these department?
waiting your recommendation
Thanks for your strategic KPIs
Hello Erica,
Could you please clarify how to set KPIs for the Strategic Planning team?
Hi Diana, check out the whitepaper above for more insight!
Hello Erica,
Could you please clarify, how to set the KPIs for the Strategic PLanning team?
Hi Diana, check out the whitepaper above for more insight!
exampels of empowerment kpis
I found great information in this article. In any case, the characteristics that KPIs must have are: measurability, effectiveness, relevance, utility and feasibility
How to write methodology guidelines for strategy implementation / a company’s review and tracking (process and workflow) for all a company’s divisions
support on strategizing Learning & Development for Automobile dealership
Could you please to clarify how to write the KPIs for the Secretary.
Check out our guide to creating KPIs for more help here: https://onstrategyhq.com/kpi-guide-download/
That’s an amazing article.
Could you please to clarify how to write the KPIs for the office boy supervisor
Could you please clarify how to write KPIs for the editorial assistant in a start up publishing company.
Kindly advice how I would set a kpi for a mattress factory